
Since the 2000 census, the total number of people living in Syracuse has remained remarkably stable. From 146,070 people in 2000 to 145,170 in 2010 to 146,620 in 2020, the City’s topline population figure has never moved more than 2.4% between censuses, and the most recent count is within 1.7% of the 2000 count.
But that remarkably stable population figure obscures Syracuse’s massive demographic churn at the neighborhood level. Between 2000 and 2020 while the City’s overall population showed just a 1.7% increase, individual neighborhoods saw population shifts ranging from a drop of 21.7% to an increase of 59.1%.

To see these neighborhood-level changes, we need to look at the census tract level. However, because the Census Bureau adjusts tract borders every 10 years, we have to group multiple tracts in order to compare similar areas over the 2000, 2010, and 2020 censuses. The map above shows the groupings (between 1 and 4 census tracts) used in this analysis.


These population change maps show the population shifts that have characterized Syracuse’s neighborhoods during the first two decades of the 21st century. The maps show areas that lost population in red, and areas that gained population in blue. The intensity of each color corresponds to the magnitude of the percentage change in population.
The Northside, the Valley, and University Hill all gained population during each of the last two decades. Salt Springs, the Southside, the Westside, Tipperary Hill, and Strathmore all lost population both from 2000 to 2010 and from 2010 to 2020.
These broad trends held constant over the last twenty years even though Syracuse as a whole shrank between 2000 and 2010 and the city grew between 2010 and 2020. The City gained population between 2010 and 2020 because Downtown and Franklin Square grew by an enormous amount (65.7%) after shrinking modestly the previous decade, and because outer neighborhoods like Eastwood and Outer Comstock grew rather than shrank during the last decade.
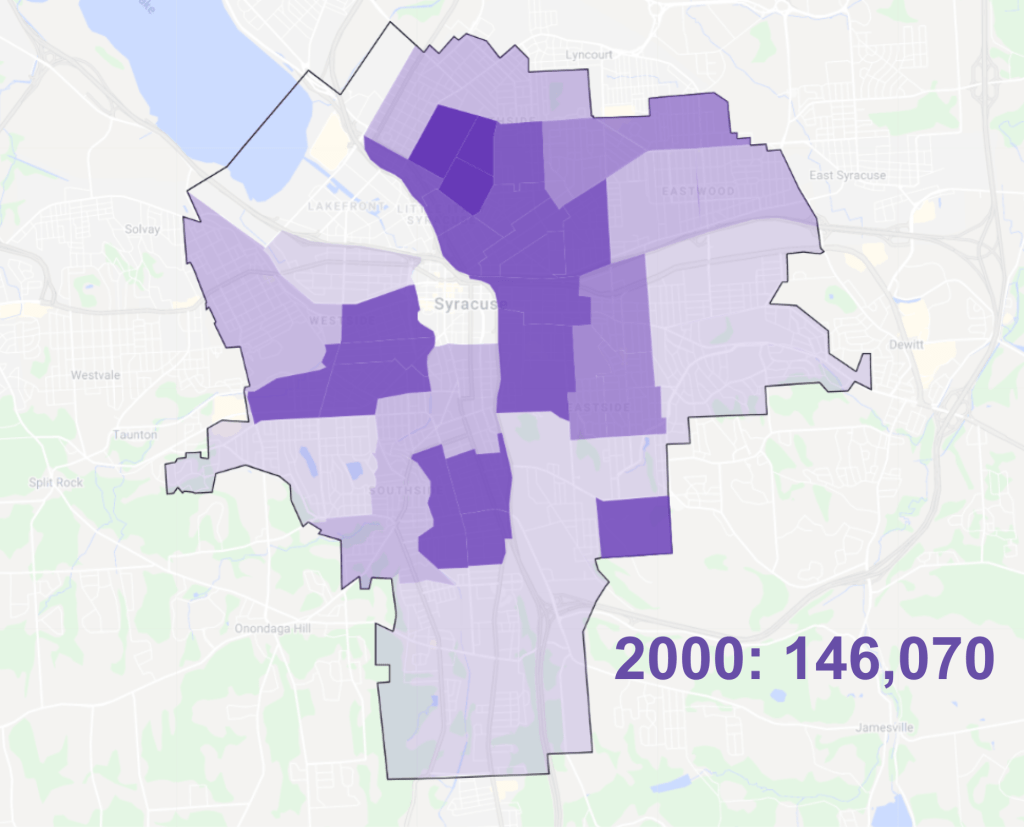
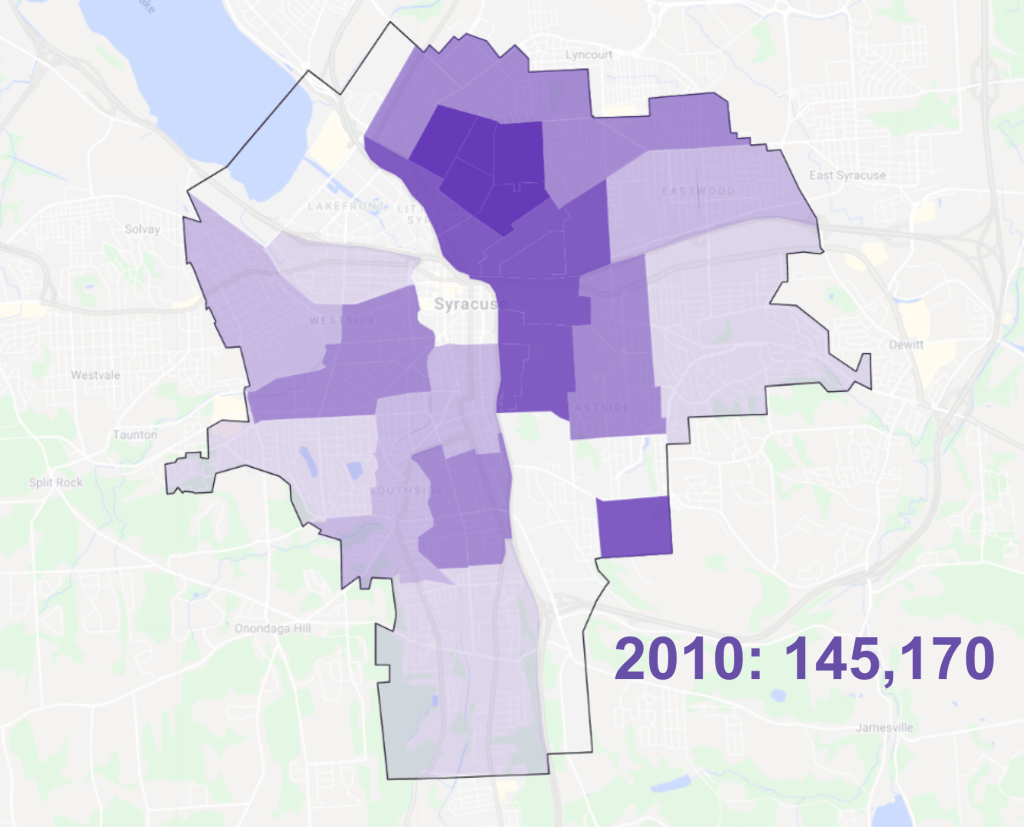
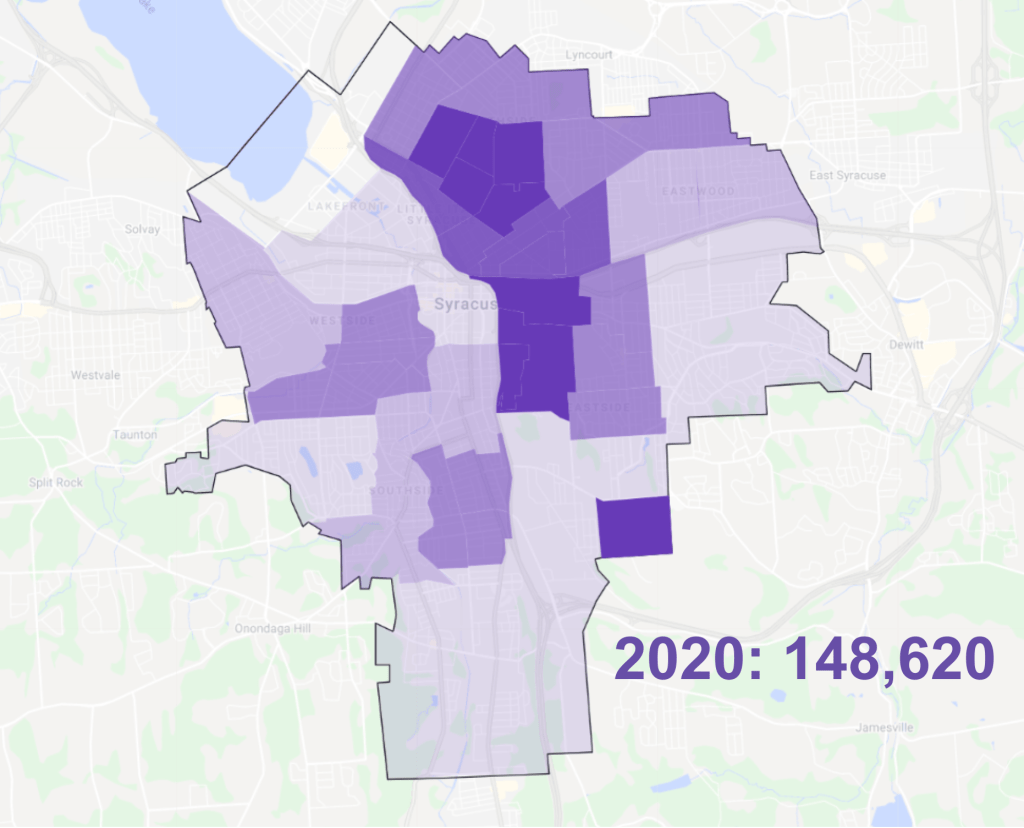
This series of density maps shows how those population trends have changed the concentration of people in different Syracuse neighborhoods has changed over the last 20 years. The South and West Sides lost a lot of density while the Northside and University Hill became much more densely populated and Downtown/Franklin Square gained some density (although this area is still nowhere near as densely populated as the surrounding inner city neighborhoods).
Overall, though, Syracuse’s patterns of density remained relatively stable between 2000 and 2020: outer neighborhoods remained sparsely populated while inner neighborhoods house lots of people in a relatively small area.
The total number of people living in Syracuse has remained essentially stable for the last 20 years, but the populations of the City’s neighborhoods have varied widely. The South and West Sides have lost a huge percentage of their total population while the Northside and the City’s center have grown dramatically. Looking forward, Syracuse will need to reverse these downward trends in its shrinking neighborhoods while also accommodating continued growth in its booming neighborhoods.
