
From 2000 to 2016, the different neighborhoods, villages, and towns that make up the City of Syracuse and Onondaga County saw huge swings in population while the County and City as a whole held steady. Those neighborhood fluctuations reveal big demographic trends that point to a very different future for the City and County.
Last week we looked at where those changes are happening. This week we’ll try and figure out who is driving them.
To do that, we’ll compare population change to two other major demographic trends—change in median age and change in median income. We’ll examine these three trends in individual census tracts as deviations from Onondaga County’s overall trend. In tract 3, for instance, median income rose by $20,208 between 2000 and 2016, but what really matters is that median income rose by $5,338 more than median income in the County as a whole.
We’ll also confine our focus to census tracts where more than 3 people live on every 2 acres of land. As we saw last week, the effects of population change are concentrated in the more densely populated areas at the center of the County, but small changes can appear exaggerated in the large, outlying, sparsely populated towns at the County’s edge. It’s the same with changes to median age and income, and it’s easier to discern these trends by focusing on their effects in the City and its more established suburbs.
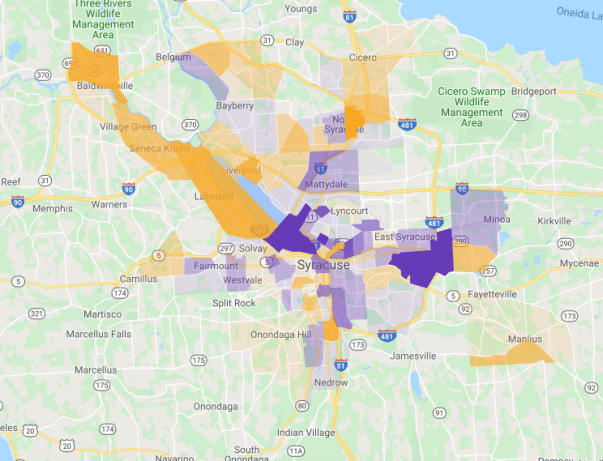
In Onondaga County, the median resident was about 2.5 years older in 2016 than the median resident in 2000. The outer suburbs drove that trend, aging significantly between 2000 and 2016 (orange). Meanwhile, most of the City and inner suburbs actually got younger (purple) over that same time. The notable exceptions were Meadowbrook, the South and West sides, and tracts like 16 and 61.01 that contain large senior living facilities.
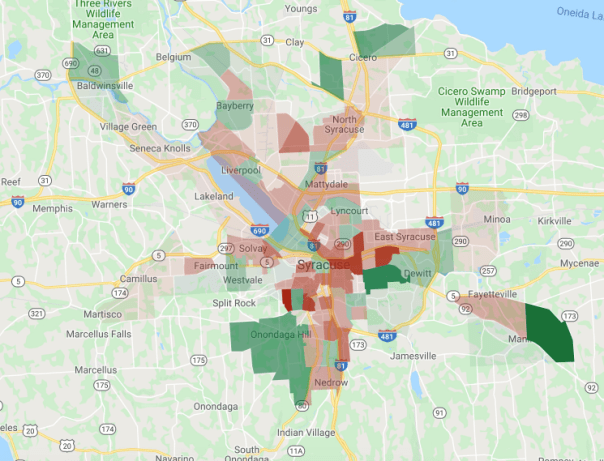
The median household in Onondaga County made about $15,000 more in 2016 than it did in 2000. In general, the neighborhoods that aged also got richer (green), and the neighborhoods that got younger also got poorer (red). That trend was reversed in some City neighborhoods like Downtown, Franklin Square, Strathmore, and Sedgwick, which got both younger and richer. On the other side, inner suburbs like Geddes and the southern part of Clay were both older and poorer in 2016 than they were in 2000.
Who is Driving Population Change?
Compare change in median age to change in median income and population change, and each census tract falls into one of 8 different categories:
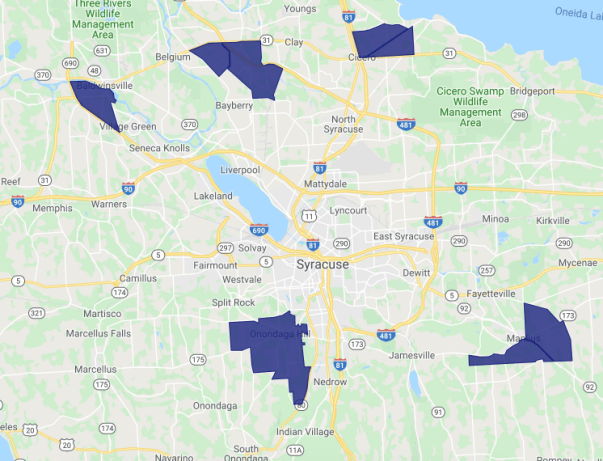
Growing, Younger, Richer:
Well-off young people are moving into city-center neighborhoods like Franklin Square and Downtown, or they’re moving into the near-in suburbs in Dewitt. Interestingly, the decision to pick the City or the County doesn’t seem to depend on whether or not these people have children—the percentage of households with children increased roughly equally in both areas between 2000 and 2016.
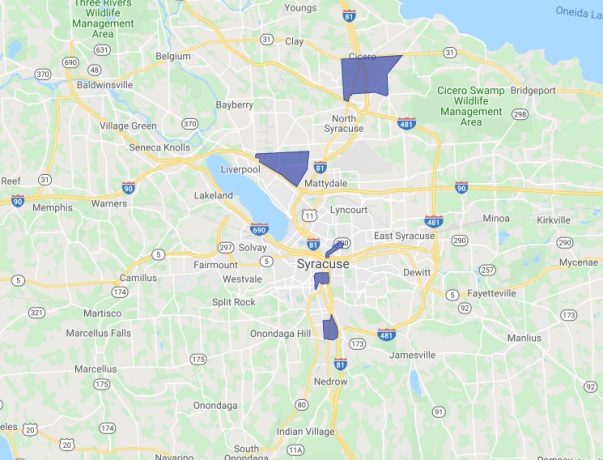
Growing, Younger, Poorer:
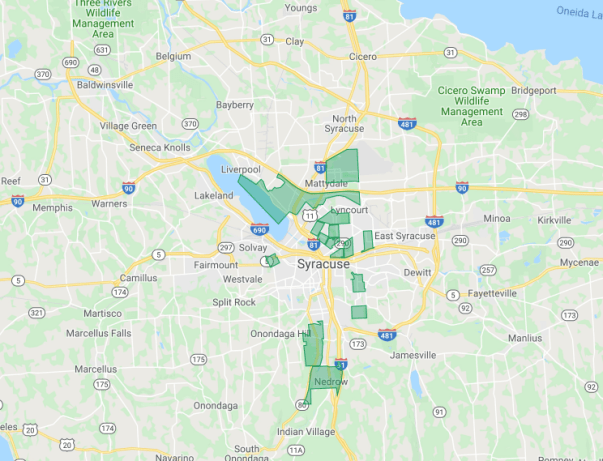
Households in all of these neighborhoods are getting bigger, but for different reasons. In the suburbs and on the Northside, bigger, poorer, younger households correlate with increases in the number of children in a household. On the Northside specifically, immigrants are driving this change—the percentage of immigrants living in census tracts 4, 6, 14, and 15 rose by more than 10 points between 2000 and 2016.
In the other City tracts—in the area around Teall Ave south of James, the foot of Tipp Hill and in Westcott—bigger households correlate with decreasing rates of children, suggesting that young people are moving in together to save on expenses.
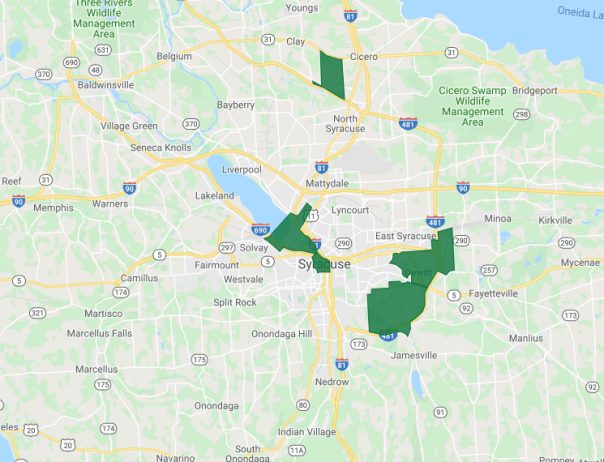
Growing, Older, Richer:
These outer areas—not one census tract in the City displays all three of these trends—are quickly transitioning from rural to suburban development. They are places with lots of new housing that have attracted older people with above average incomes.
Growing, Older, Poorer:
In the City, these are tracts with big senior housing complexes.
The suburban tracts are less straightforward. Tract 135 in Salina has added almost 700 households between 2000 and 2016, and the proportion of households with children held steady over that time, but the neighborhood still aged by almost 6.5 years. In 2016 the median resident was 48.4—10 years older than the media resident of the County.
Shrinking, Younger, Richer:
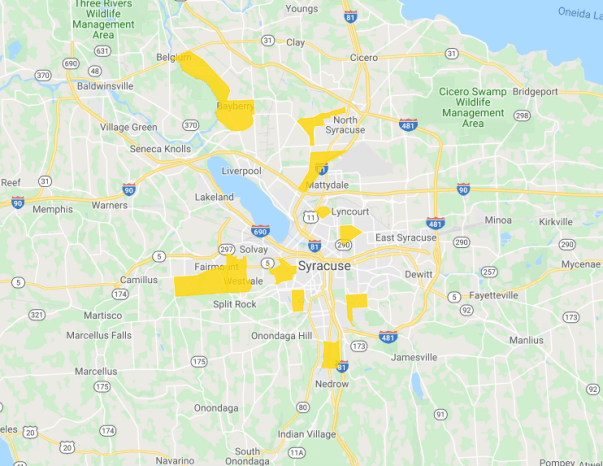
In the City, these are neighborhoods like Sedgwick, Strathmore, Tipp Hill, and the University Area where older residents have moved away and been replaced by new young families. Despite the new well-off residents—or maybe because of them—these neighborhoods are still shrinking because those new families are smaller than the households they replaced. That’s even true in several tracts where families were more likely to have children in 2016 than in 2000.
In the County, these are some of the very oldest post-war suburbs like Bayberry and Westvale. The households moving into these neighborhoods are younger, richer, and smaller, but they’re also less likely to have children. If these couples start having kids and raising families, then these neighborhoods might start growing in the near future.
Shrinking, Younger, Poorer:

This trends typify a huge swath of the City, stretching from the Eastside to the Southside in a continuous arc. This is the blackest part of the City (and County), and it has suffered decades of targeted racist disinvestment and oppression.
Something similar is happening in suburban spots like Mattydale and the G streets in Clay.
Shrinking, Older, Richer:
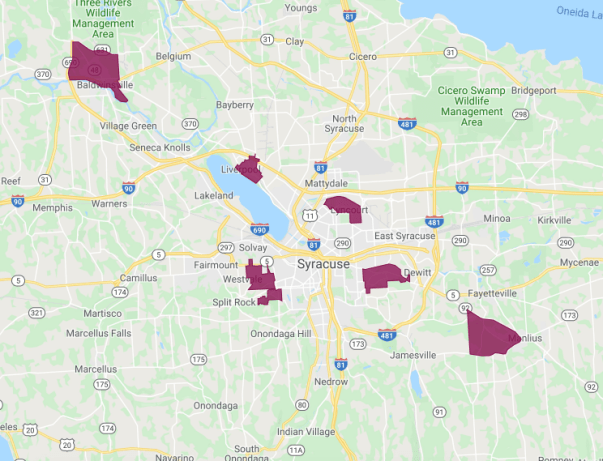
In City neighborhoods like Meadowbrook and Winkworth, and in suburban villages like Baldwinsville, Liverpool, and Manlius, an aging population, declining number of children, high housing costs, and restrictions on new construction have combined to bring the population down, while the residents that remain are increasingly richer and older than the rest of the County.
Shrinking, Older, Poorer:

These trends typify another huge swatch of the City, stretching from Solvay through the Westside down along the South Ave Corridor. This part of the City, too, has suffered from decades of disinvestment and neglect, particularly around Onondaga Creek where the frequent flooding and federal policies have contributed to housing instability.
This pattern repeats in the suburbs in parts of Camillus, Clay, and Dewitt, but primarily along the 690 corridor from the City line all the way to Baldwinsville through Lakeland, Seneca Knolls, and Village Green.
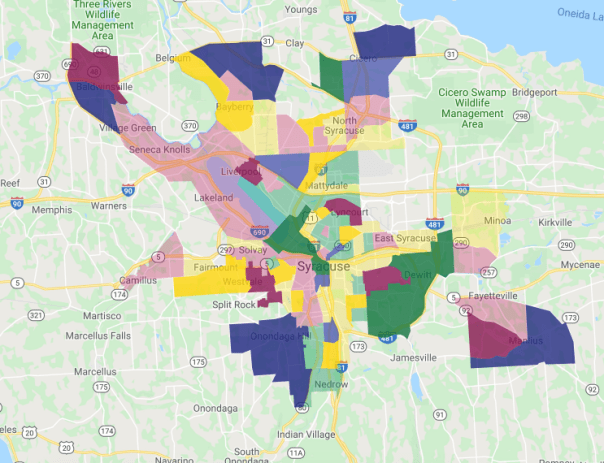
Put all of that together and you get a pretty good picture of who is driving population change in Onondaga County. This map shows the area’s population radiating from the City along six major highways: Interstates 81 and 690, and Routes 5, 11, 57, and 92. The metro area is growing in a classic donut pattern, with the most intense population increases occurring in the outer suburbs and the city center. Older people are driving that growth at the outer ring, while younger families are driving it in the inner core. Wealth is also either moving out to the County’s edge or concentrating in a few spots at its center. Many areas in the middle are getting smaller, and most all are getting poorer.
Next week, we’ll suss out why all of this matters for the City and the County’s future.
