
After decades of massive gains and losses, the populations of both the City of Syracuse and Onondaga County have held steady in the 21st century. But that broad stability masks huge changes in the neighborhoods, villages, and towns that make up the City and County. Look at them more closely, and those neighborhood fluctuations reveal demographic trends that complicate our understanding of the present and point towards a very different future.
Through the end of the year, let’s take that closer look in order to get a clearer picture of where we are and where we’re going.
Where is population rising, and where is it falling?
About 10,000 more people lived in Onondaga County in 2016 than did in 2000. This map shows which parts of the County gained people (in blue) and which parts lost them (in red) over that time.
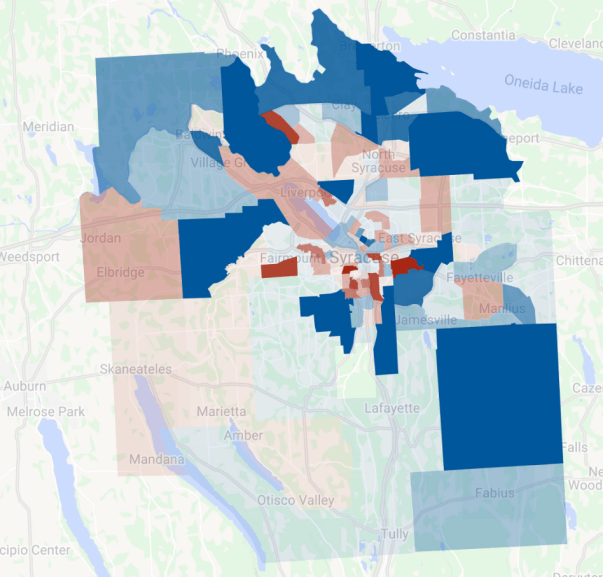
Lysander, Clay, and Cicero on the County’s northern edge all gained a lot of people. So did parts of the more central towns of Camillus, Onondaga, Dewitt, and Pompey. These are all places where new suburbs meet the countryside.
Older suburban communities in Salina, Geddes, and the southern parts of Clay and Cicero, on the other hand, lost population. The county’s villages are also losing people—even those like Baldwinsville that are surrounded by new booming suburban development.
The City’s success stories—Downtown, Franklin Square, and Westcott—all gained a few people since 2000. So did outer streetcar suburbs like Eastwood, the far Northside, Salt Springs, and Nedrow. The real boom, though, was on the Northside around Butternut and Lodi where thousands of new people now live in one of the County’s oldest neighborhoods.
Meanwhile, people moved away from the South and West sides—particularly around Gifford Street and the flood-prone areas near Onondaga Creek. Population also fell on the parts of the Northside, Near Eastside, and University Hill where major institutions like St Joseph’s, SHA, and SU demolished housing. The City’s richest neighborhoods—Strathmore, Bradford Hills, Meadowbrook, and Sedgwick—all also lost people since 2000.
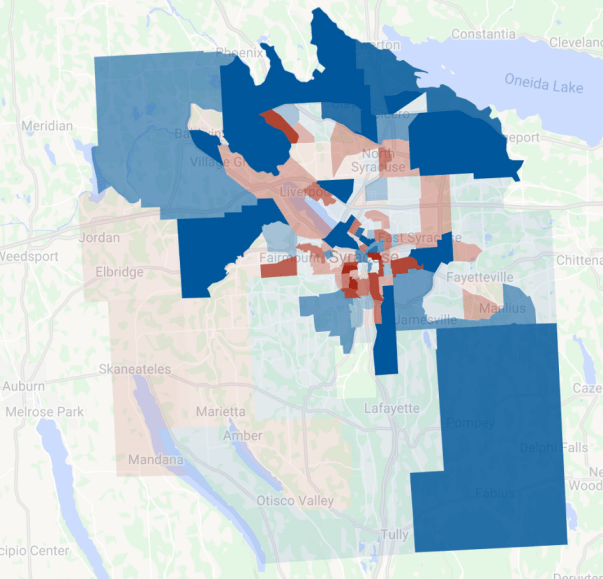
Some trends are even more pronounced when you compare an area’s population gains or losses to its starting population. This map, which shows population change as a percentage of the population of each census tract in 2000, highlights the suburban boom along the County’s northern border. For example, tract 113—the part of the Town of Clay north of Rt 31—gained 680 people between 2000 and 2016. That was the 17th largest increase of any census tract over that time, but because so few people lived in that part of the County in 2000, 680 new people represented a 27% increase in tract 113’s population—the 10th largest percentage jump for any tract.
Something similar happened in Franklin Square and the Inner Harbor where a seemingly modest 270 person increase in population—only the 34th largest jump—meant that census tract 1 grew by 67%—the 2nd largest percentage increase in the entire County.

However, both of these maps obscure the intensity of these changes in population because neither accounts for the amount of space in which they occur. The populations of both Fabius and Hawley-Green rose by just over 300 people (or about 16%) between 2000 and 2016, but in Fabius those 314 new people could spread out over an area more than 250 times as large as Hawley-Green. The new people in Hawley-Green made a more concentrated impact than did those in Fabius.
This map of the change in population density in each census tract shows that the changes in population have been much more acute in City neighborhoods than in the rest of the County. Parts of the Northside have gained more than 10 people per acre, while in almost all of the outer suburbs—even places like tract 113 where population soared—any gains were spread out over such a large area that population increased by less than 1/20th of a person per acre.


The total number of people living in both Onondaga County and the City of Syracuse has remained stable since 2000. But over that same period of time the populations of individual neighborhoods, villages, and towns have been anything but stable. Broadly speaking, outer suburbs are growing while inner suburbs are shrinking. In Syracuse, Downtown and the Northside are growing, while the South and West sides are shrinking. Some areas where very few people lived in 2000—places like Franklin Square and the northern part of the Town of Clay—have seen huge increases in population. At the same time, the only places where changes in total population have resulted in significant changes in population density have been in City neighborhoods.
Next week, we’ll unpack these numbers to try and figure out who is driving these changes to the City and County’s populations.
