
Syracuse has long been one of the youngest municipalities in the county, and SCSD is one of the only districts that’s seen a growing enrollment in recent years. But over the last decade, Syracuse’s population started aging, and the total number of children decreased while the City’s adult population grew.
Like variations in total population, these changes were not even across neighborhoods. Their spatial distribution correlates with population gains and losses, and suggests that if Syracuse is going to achieve sustained growth, it will need to do better by the kids.
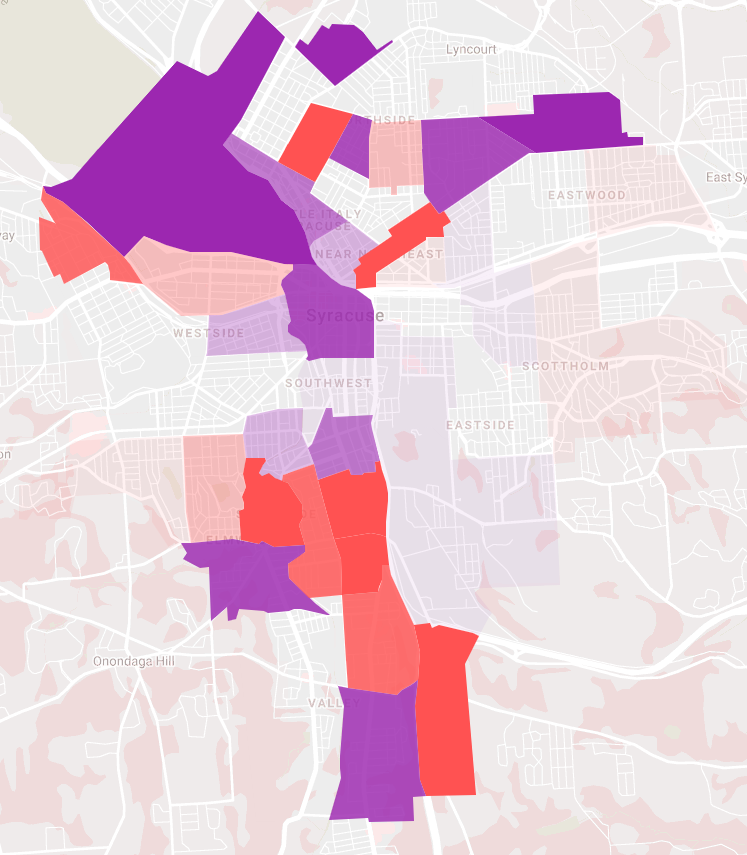
Median age is dropping fast (purple on the map) in the City’s center and in some outer neighborhoods like the far Northside, Eastwood, Elmwood, and the Valley. In general, these areas gained population over the last decade. Population in tracts where the median age decreased gained 2,473 people between 2010 and 2019.
Median age is rising ( pink on the map) across much of the Southside and in areas with large retirement homes like Ross Towers, Vinette Towers, Brighton Towers and Loretto. All together, census tracts where the median age increased lost 4,333 people over the last decade.

In census tracts where the median age fell, children under the age of 18 tended to comprise a greater share of the population in 2019 than in 2010 (green on the map), and the reverse was true of tracts where the proportion of children fell (orange on the map).
Combined, census tracts where children under the age of 18 made up a smaller share of the population in 2019 than in 2010 shrank by 3588 people over that time. Census tracts where children accounted for a larger share of the population grew by 1728 over the same period.
These trends make sense. If a family of three becomes a family of four, if an adult couple has their first child, or if a retired couple moves south and sells their house to a family with kids—if any of those changes occur, it will show up in the census data by lowering the median age, increasing the proportion of children to adults, and growing the overall population.
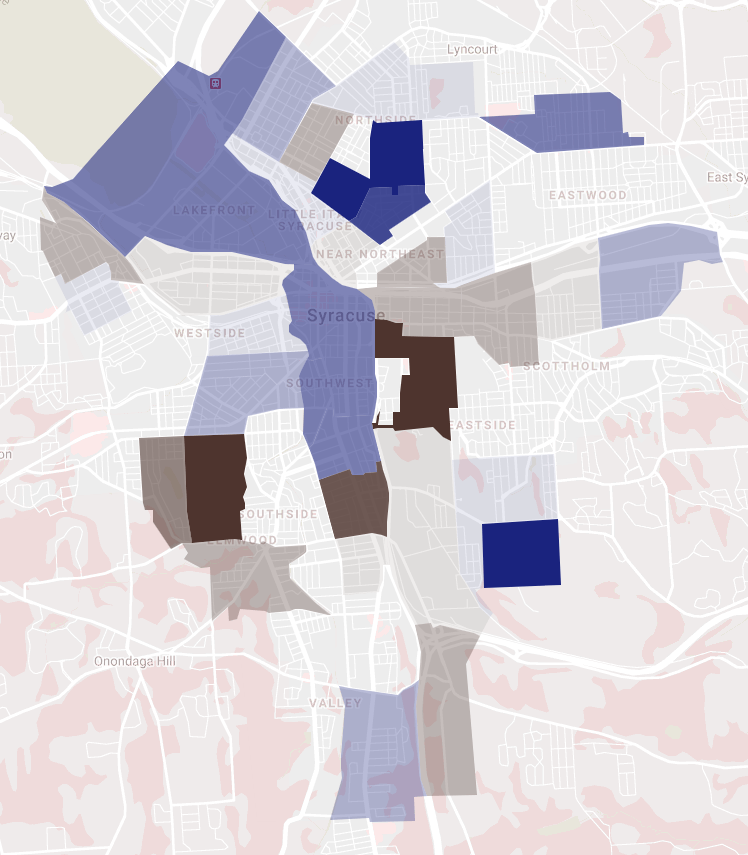
And so what you see pretty clearly is that the census tracts where the proportion of children to adults grew between 2010 and 2019 generally also saw rising household sizes (in blue on map) over that time.

It’s an open question whether these trends will continue. In the parts of the City where kids are a growing share of the population, most of the growth (84%) came from census tracts where the population of children ages 0-5 (below school age, yellow on the map) outpaced the population of children 6-17 (school age, blue on the map). This increase in the proportion of young families could be a very good thing for Syracuse if it means that the City is gaining a stable cohort of long-term residents. But the increasing percentage of children below school age in growing neighborhoods could also signal something very bad—that families in growing neighborhoods are leaving the City when their kids start school.
